GLOBALISATION
Mind Map method
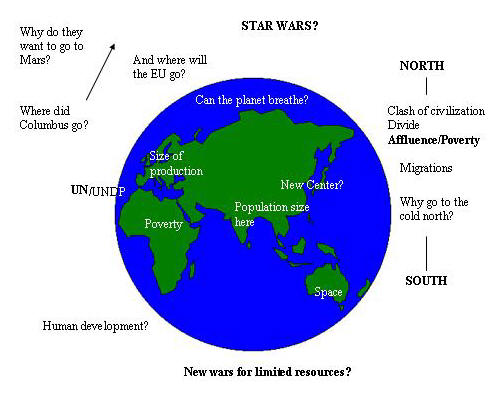 |
1. Use the mind map as inspiration for your own map. Make a
mind map of the world where you make a list of all the things you find
interesting - and threatening in the development of the world today.
2. When you have made a list of all the problems, how do you find some solutions? - how can these problems be solved? Find an ideal way to solve them, and perhaps what you consider is the realistic way of solving them. Find information on the Internet that can help you. |
CENTRE PERIPHERY - PROJECT WORK
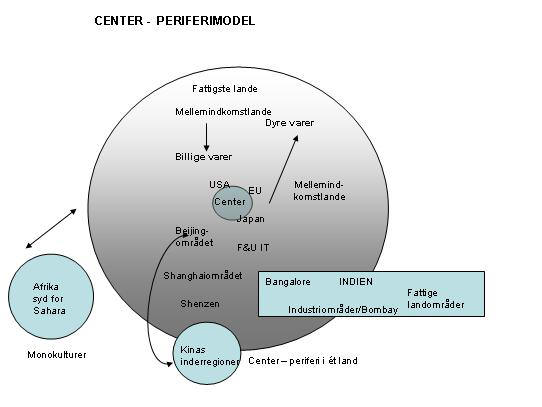 |
To your left you see the centre periphery
model, which is one of the ways in which the development problems have
been analysed in World System theory and by academics in the poor countries, especially Latin
America and India. Through hot spots in the image you can link to
statistics sources on development problems. 1. Use these links to prepare a report on development problems. 2. Find literature that illustrates these problems, e.g. www.chowk.com, Outlook India. |
VOCABULARY
| Access to the Internet | |
| employment opportunities | |
| Education | |
| Interconnected | |
| Outsourcing | |
| Call Centre | |
| High wages | |
| Low wages | |
| Investments | |
| Free movement across borders | |
| Telecommunications | |
| Global Village | |
| Globalize | |
| Local and Global | |
| Foreign direct Investment | |
| Trade | |
| Information flows | |
| International Monetary Fund and World Bank | |
| United Nations and human rights | |
| UN Millennium Goals | |
| Competititon across borders | |
| Compete | |
| Competitive | |
| Global Warming | |
| Pollution knows no borders | |
| Drug trade | |
| High Cost of Labour | |
USING A VOCABULARY
Conversation on development problems. A is from a rich country. B is
from a poor country
B: You're from a rich country. My country is
poor. Why is it so?
A: Our cold climate makes people work. They always had to work to get food
and shelter.
B: Bad explanation. Nowadays people use air conditioners. The climate
doesn't anything any more. Some hot areas are highly developed, for instance
Southern California, Florida, southern China. The causes of poverty lie in
colonization. You colonised us, we didn't get enough education. We were
competed out of markets by you.
A: We had more
economic growth than you did.
B: You made unfair trade deals (handelsaftaler), and you continue doing so
by dominating the
World Trade Organization, WTO
A: A lot of people in other countries are protesting against that, take
Global
Exchange or
Mellemfolkeligt Samvirke. We want to help you. A lot of people in the
West are in favour of
fair
trade instead of free trade. The NGO
Oxfam has
written reports on this theme. We also give development assistance. The
Danish DANIDA
for instance gives almost 1 per cent of Danish gross national product (GNP)
in development assistance. This organisation has also put a lot of
information, i.e.
statistics, on development problems at the disposal of the general
public.
B: You primarily give development assistance to help your own companies.
A: ???
B: Development loans and projects help your own companies to build up
business contacts and networks, and financial assistance is generally tied
to purchasing things from your own country.
A: Some development assistance is untied. You can buy from wherever you want.
Continue the discussion.....
VOCABULARY - World Bank Data Profiles
| People - mennesker | |
| Population, total |
Befolkning i alt |
| Population growth (annual %) | Befolkningsvækst (årlig procent) |
| Population density (people per sq. km) | Befolkningstæthed (mennesker pr kvadratkm) |
| Life expectancy at birth (years) | Livslængde v. fødsel (år) |
| Fertility rate, total (births per woman) | Fertilitets- (frugtbarheds-)rate, i alt (fødsler pr kvinde) |
| Mortality rate, infant (per 1,000 live births) | Dødelighedsrate, spædbørn (pr 1000 levendefødte) |
| Mortality rate, under-5 (per 1,000 live births) | Dødsrate for under 5 årige (pr 1000 levendefødte) |
| Malnutrition prevalence (% of children under 5) | Forekomst af dårlig ernæring (procent af børn under 5) |
| Urban population (% of total) | Befolkning i byer (procent af alle) |
| Rural population density (per sq. km of arable land) | Befolkningstæthed på landet (pr kvadratkm. opdyrkelig land) |
| Illiteracy rate, adult male (% of males 15+) | Analfabetisme rate, voksne mænd (pct af mænd over 15) |
| Illiteracy rate, adult female (% of females 15+) | Analfabetisme rate, voksne kvinder (pct af kvinder over 15) |
| School enrollment, primary (% net) | Skolegang i primærskole |
| School enrollment, secondary (% net) | Skolegang i sekundærskole |
| School enrollment, primary, female (% net) | Skolegang i primærskole, kvinder pct netto |
| School enrollment, secondary, female (% net) | Skolegang i sekundærskole kvinder pct netto |
| Environment miljø | |
| Surface area (sq. km) | Overflade areal kv. km |
| Forest area (sq. km) | Skovareal kv. km |
| Annual deforestation (% of change) | Årlig fjernelse af skov pct ændring |
| Freshwater resources per capita (cubic meters) | Friskvandsressourcer pr indbygger kubikmeter |
| CO2 emissions (metric tons per capita) | CO2 udledninger (metriske tons pr indbygger) |
| Improved water source, urban (% of urban population with access) | Forbedret vandressource, bymæssig (pct af bybefolkning med adgang til vand) |
| Improved sanitation facilities, urban (% of urban population with access) | Forbedrede sanitetsfaciliteter, bymæssig (pct af bybefolkning med adgang) |
| Commercial energy use (kg of oil equivalent per capita) | Kommercielt energiforbrug (kg af olieækvivalent pr indbygger) |
| Electric power consumption per capita (kwh) | Elektrisk kraftforbrug pr indbygger (kw time) |
| Economy Økonomi | |
| GNI, Atlas method (current US$) | Bruttonationalindkomst løbende dollars |
| GNI per capita, Atlas method (current US$) | Bruttonationalindkomst pr indbygger løbende dollars |
| GDP (current $) | BNP løbende dollars |
| GDP growth (annual %) | BNP vækst (årlig pct) |
| Inflation, GDP deflator (annual %) | Inflation (BNP deflator årlig pct) |
| Agriculture, value added (% of GDP) | Landbrug, med rå- og hjælpestoffer fratrukket (pct af BNP) |
| Industry, value added (% of GDP) | Industri, med rå- og hjælpestoffer fratrukket (pct af BNP) |
| Services, etc., value added (% of GDP) | Tjenester, etc., med rå og hjælpestoffer fratrukket (pct af BNP) |
| Exports of goods and services (% of GDP) | Eksport af varer og tjenester (pct af BNP) |
| Imports of goods and services (% of GDP) | Import af varer og tjenester (pct af BNP) |
| Gross capital formation (% of GDP) | Brutto kapitaldannelse (pct af BNP) |
| Current revenue, excluding grants (% of GDP) | Løbende indkomst, ikke medregnet gaver (pct af BNP) |
| Overall budget deficit, including grants (% of GDP) | Overordnet budgetunderskud, incl. gaver (pct af BNP) |
| Money and quasi money growth (annual %) | Penge- og kvasipenge vækst (årlig pct) |
| Technology and infrastructure - teknologi og infrastruktur | |
| Telephone mainlines (per 1,000 people) | Telefonlinjer pr 1000 mennesker |
| Telephone average cost of local call (US$ per three minutes) | Gennemsnitlig omkostning for lokalt opkald (dollars pr tre minutter) |
| Personal computers (per 1,000 people) | PC'er pr 1000 mennesker |
| Internet hosts (per 10,000 people) | Internet hosts pr 10000 mennesker |
| Paved roads (% of total) | Asfalterede veje (pct af samtlige) |
| Aircraft departures | Afgange via lufthavne |
| Trade and finance Handel og finansiering | |
| Trade in goods as a share of PPP GDP (%) | Handel med varer som en andel af købekraftsjusteret BNP (pct) |
| Trade in goods as a share of goods GDP (%) | Handel med varer som andel af varer- BNP |
| High-technology exports (% of manufactured exports) | High-tech eksport som pct andel af industrieksport |
| Net barter terms of trade (1995=100) | Bytteforhold (eksportpriser divideret med importpriser) (1995=100) |
| Foreign direct investment, net inflows in reporting country (WDI, current US$) | Udenlandske investeringer, nettotilstrømning i rapporterende land (løbende dollars) |
| Present value of debt (current US$) | Nuværende værdi af gæld (løbende dollars) |
| Total debt service (current US$) | Totalomkostning til servicering (renter og afdrag) af gæld (løbende dollars) |
| Short-term debt outstanding (current US$) | Kortfristet udestående gæld (løbende dollars) |
| Aid per capita (current US$) | U-landsbistand pr indbygger (løbende dollars) |
ARGENTINA DANMARK Globalization indicators - learn an Economic Vocabulary
|
Argentina |
|
||||||||||||
|
|
|
|
|
|
|
|
|
|
|
|
|
|
|
|
BASIC INDICATORS |
|
|
|
|
|
|
|
|
|
|
|
||
|
Population (thousands, 2004) |
|
38 226 |
|
Rank in world trade, 2004 |
Exports |
Imports |
|
||||||
|
GDP (million current US$, 2004) |
|
151 501 |
|
Merchandise |
|
|
43 |
49 |
|
||||
|
GDP (million current PPP US$, 2004) |
|
486 366 |
|
Commercial services |
|
50 |
46 |
|
|||||
|
Current account balance (million US$, 2004) |
3 281 |
|
Merchandise excluding intra-EU trade |
28 |
32 |
|
|||||||
|
Trade (handel) per capita (US$, 2002-2004) |
|
1 436 |
|
Commercial serv. excl. intra-EU trade |
32 |
29 |
|
||||||
|
Trade to GDP ratio (andel) (2002-2004) |
|
42.6 |
|
|
|
|
|
|
|
|
|||
|
|
|
|
|
|
|
|
Annual percentage change |
|
|||||
|
|
|
|
|
|
2004 |
|
1995-2004 |
2003 |
2004 |
|
|||
|
Real GDP (1995=100) |
|
115 |
|
2 |
9 |
9 |
|
||||||
|
Exports of goods and services (volume, 1995=100) |
157 |
|
5 |
6 |
4 |
|
|||||||
|
Imports of goods and services (volume, 1995=100) |
123 |
|
2 |
38 |
45 |
|
|||||||
|
|
|
|
|
|
|
|
|
|
|
|
|
|
|
|
|
|
|
|
|
|
|
|
|
|
|
|
|
|
|
TRADE POLICY |
|
|
|
|
|
|
|
|
|
|
|
|
|
|
WTO accession date |
1 January 1995 |
|
Contribution to WTO budget (%, 2006) |
0.360 |
|
||||||||
|
Trade Policy Review date |
20, 22 January 1999 |
|
Import duties collected (%, 2002-2004): |
|
|
||||||||
|
|
|
|
|
|
|
|
in total tax revenue |
|
|
2.8 |
|
||
|
Tariff binding coverage (%, 2004) |
|
100.0 |
|
to total merchandise imports |
|
4.9 |
|
||||||
|
MFN tariffs |
|
|
Final bound |
Applied 2004 |
|
|
|
|
|
|
|
|
|
|
Simple average of ad-valorem duties |
|
|
|
Number of: |
|
|
|
|
|
||||
|
All goods |
|
|
|
31.9 |
12.7 |
|
GATS services sectors with commitments |
63 |
|
||||
|
Agricultural goods (AOA) |
32.6 |
12.0 |
|
Dispute rulings (complainant - defendant) |
2 - 6 |
|
|||||||
|
Non-agricultural goods |
31.8 |
12.9 |
|
Notifications outstanding (CRN) |
|
13 |
|
||||||
|
|
|
|
|
|
|
|
|
|
|
|
|
|
|
|
Non ad-valorem duties (% of total tariff lines) |
0.0 |
0.0 |
|
Number of contingency measures in force: |
|
|
|||||||
|
|
|
|
|
|
|
|
Anti-dumping (30 June 2005) |
56 |
|
||||
|
MFN duty free imports |
|
|
|
|
Countervailing duties (30 June 2005) |
3 |
|
||||||
|
Share in total imports, 2001 |
4.8 |
|
Safeguards (3 November 2005) |
0 |
|
||||||||
|
|
|
|
|
|
|
|
|
|
|
|
|
|
|
|
|
|
|
|
|
|
|
|
|
|
|
|
|
|
|
MERCHANDISE TRADE |
|
|
Value |
|
Annual percentage change |
|
|||||||
|
|
|
|
|
|
2004 |
|
1995-2004 |
2003 |
2004 |
|
|||
|
Merchandise exports, f.o.b. (million US$) |
34 550 |
|
6 |
15 |
17 |
|
|||||||
|
Merchandise imports, c.i.f. (million US$) |
22 445 |
|
1 |
54 |
62 |
|
|||||||
|
|
|
|
|
|
|
|
|
|
|
|
|
|
|
|
|
|
|
|
|
2004 |
|
|
|
|
|
2004 |
|
|
|
Share in world total exports |
0.38 |
|
Share in world total imports |
0.24 |
|
||||||||
|
|
|
|
|
|
|
|
|
|
|
|
|
|
|
|
Breakdown in economy's total exports |
|
|
Breakdown in economy's total imports |
|
|
||||||||
|
By main commodity group (ITS) |
|
|
By main commodity group (ITS) |
|
|
||||||||
|
Agricultural products |
|
|
49.6 |
|
Agricultural products |
|
|
5.1 |
|
||||
|
Fuels and mining products |
|
20.0 |
|
Fuels and mining products |
|
6.6 |
|
||||||
|
Manufactures |
|
|
|
28.6 |
|
Manufactures |
|
|
|
87.2 |
|
||
|
|
|
|
|
|
|
|
|
|
|
|
|
|
|
|
By main destination |
|
|
By main origin |
|
|
||||||||
|
1. European Union (25) |
|
|
18.3 |
|
1. Brazil |
|
|
|
32.5 |
|
|||
|
2. Brazil |
|
|
|
|
15.8 |
|
2. European Union (25) |
|
|
18.2 |
|
||
|
3. Chile |
|
|
|
|
11.2 |
|
3. United States |
|
|
14.7 |
|
||
|
4. United States |
|
|
10.8 |
|
4. Japan |
|
|
|
6.9 |
|
|||
|
5. China |
|
|
|
|
7.7 |
|
5. China |
|
|
|
6.0 |
|
|
|
|
|
|
|
|
|
|
|
|
|
|
|
|
|
|
|
|
|
|
|
|
|
|
|
|
|
|
|
|
|
COMMERCIAL SERVICES TRADE |
|
Value |
|
Annual percentage change |
|
||||||||
|
|
|
|
|
|
2004 |
|
1995-2004 |
|
2003 |
2004 |
|
||
|
Commercial services exports (million US$) |
5 135 |
|
4 |
28 |
24 |
|
|||||||
|
Commercial services imports (million US$) |
6 625 |
|
-1 |
15 |
23 |
|
|||||||
|
|
|
|
|
|
|
|
|
|
|
|
|
|
|
|
|
|
|
|
2004 |
|
|
|
|
|
2004 |
|
||
|
Share in world total exports |
0.24 |
|
Share in world total imports |
0.31 |
|
||||||||
|
|
|
|
|
|
|
|
|
|
|
|
|
|
|
|
Breakdown in economy's total exports |
|
|
Breakdown in economy's total imports |
|
|
||||||||
|
By principal services item |
|
|
By principal services item |
|
|
|
|||||||
|
Transportation |
|
22.4 |
|
Transportation |
|
24.5 |
|
||||||
|
Travel |
|
49.9 |
|
Travel |
|
44.7 |
|
||||||
|
Other commercial services |
|
27.7 |
|
Other commercial services |
|
30.8 |
|
||||||
|
|
|
|
|
|
|
|
|
|
|
|
|
|
|
|
|
|
|
|
|
|
|
|
|
|
|
|
|
|
|
INDUSTRIAL PROPERTY |
|
|
|
|
|
|
|
|
|
|
|
||
|
|
|
|
Total |
Residents |
Non-residents |
|
|
|
|
Total |
Residents |
Non-residents |
|
|
Patents granted, 2000 |
1 587 |
145 |
1 442 |
|
Marks registered, 2002 |
53 388 |
35 474 |
17 914 |
|
||||
|
|
|
|
|
|
|
|
|
|
|
|
|
|
|
|
|
|
|
|
|
|
|
|
|
|
|
|
|
|
|
|
|
|
|
|
|
|
|
|
|
|
|
|
|
|
Denmark |
|
|
||||||||||||
|
|
|
|
|
|
|
|
|
|
|
|
|
|
|
|
|
BASIC INDICATORS |
|
|
|
|
|
|
|
|
|
|
|
|
||
|
Population (thousands, 2004) |
|
5 397 |
|
Rank in world trade, 2004 |
Exports |
Imports |
|
|
||||||
|
GDP (million current US$, 2004) |
|
243 043 |
|
Merchandise |
|
|
29 |
28 |
|
|
||||
|
GDP (million current PPP US$, 2004) |
|
172 569 |
|
Commercial services |
|
20 |
17 |
|
|
|||||
|
Current account balance (million US$, 2004) |
5 941 |
|
Merchandise excluding intra-EU trade |
- |
- |
|
|
|||||||
|
Trade per capita (US$, 2002-2004) |
|
33 656 |
|
Commercial serv. excl. intra-EU trade |
- |
- |
|
|
||||||
|
Trade to GDP ratio (2002-2004) |
|
86.7 |
|
|
|
|
|
|
|
|
|
|||
|
|
|
|
|
|
|
|
Annual percentage change |
|
|
|||||
|
|
|
|
|
|
2004 |
|
1995-2004 |
2003 |
2004 |
|
|
|||
|
Real GDP (1995=100) |
|
120 |
|
2 |
0 |
2 |
|
|
||||||
|
Exports of goods and services (volume, 1995=100) a |
158 |
|
6 |
0 |
... |
|
|
|||||||
|
Imports of goods and services (volume, 1995=100) a |
164 |
|
6 |
0 |
... |
|
|
|||||||
|
|
|
|
|
|
|
|
|
|
|
|
|
|
|
|
|
|
|
|
|
|
|
|
|
|
|
|
|
|
|
|
|
TRADE POLICY |
|
|
|
|
|
|
|
|
|
|
|
|
|
|
|
WTO accession date |
1 January 1995 |
|
Contribution to WTO budget (%, 2006) |
0.970 |
|
|
||||||||
|
Trade Policy Review date |
24, 26 July 2002 |
|
Import duties collected: |
|
|
|
|
|||||||
|
|
|
|
|
|
|
|
in total tax revenue |
|
|
... |
|
|
||
|
Tariff binding coverage (%, 2004) |
|
100.0 |
|
to total merchandise imports |
|
... |
|
|
||||||
|
MFN tariffs |
|
|
Final bound |
Applied 2005 |
|
|
|
|
|
|
|
|
|
|
|
Simple average of ad-valorem duties |
|
|
|
Number of: |
|
|
|
|
|
|
||||
|
All goods |
|
|
|
4.1 |
4.2 |
|
GATS services sectors with commitments |
115 |
|
|
||||
|
Agricultural goods (AOA) |
X |
5.9 |
|
Dispute rulings (complainant - defendant) |
26 - 21 |
|
|
|||||||
|
Non-agricultural goods |
3.9 |
4.0 |
|
Notifications outstanding (CRN) |
|
22 |
|
|
||||||
|
|
|
|
|
|
|
|
|
|
|
|
|
|
|
|
|
Non ad-valorem duties (% of total tariff lines) |
6.0 |
5.9 |
|
Number of contingency measures in force: |
|
|
|
|||||||
|
|
|
|
|
|
|
|
Anti-dumping (30 June 2005) |
167 |
|
|
||||
|
MFN duty free imports |
|
|
|
|
Countervailing duties (30 June 2005) |
16 |
|
|
||||||
|
Share in total imports, 2004 |
52.6 |
|
Safeguards (3 November 2005) |
1 |
|
|
||||||||
|
|
|
|
|
|
|
|
|
|
|
|
|
|
|
|
|
|
|
|
|
|
|
|
|
|
|
|
|
|
|
|
|
MERCHANDISE TRADE |
|
|
Value |
|
Annual percentage change |
|
|
|||||||
|
|
|
|
|
|
2004 |
|
1995-2004 |
2003 |
2004 |
|
||||
|
Merchandise exports, f.o.b. (million US$) |
77 079 |
|
5 |
16 |
16 |
|||||||||
|
Merchandise imports, c.i.f. (million US$) |
68 157 |
|
4 |
14 |
19 |
|
|
|||||||
|
|
|
|
|
|
|
|
|
|
|
|
|
|
|
|
|
|
|
|
|
|
2004 |
|
|
|
|
|
2004 |
|
||
|
Share in world total exports |
0.84 |
|
Share in world total imports |
0.71 |
||||||||||
|
|
|
|
|
|
|
|
|
|
|
|
|
|
|
|
|
Breakdown in economy's total exports |
|
|
Breakdown in economy's total imports |
|
|
|
||||||||
|
By main commodity group (ITS) |
|
|
By main commodity group (ITS) |
|
|
|
||||||||
|
Agricultural products |
|
|
21.0 |
|
Agricultural products |
|
|
15.2 |
|
|
||||
|
Fuels and mining products |
|
9.3 |
|
Fuels and mining products |
|
6.9 |
|
|
||||||
|
Manufactures |
|
|
|
60.7 |
|
Manufactures |
|
|
|
75.8 |
|
|
||
|
|
|
|
|
|
|
|
|
|
|
|
|
|
|
|
|
By main destination |
|
|
By main origin |
|
|
|
||||||||
|
1. European Union (25) |
|
|
64.4 |
|
1. European Union (25) |
|
|
71.5 |
|
|
||||
|
2. Norway |
|
|
|
|
5.5 |
|
2. Norway |
|
|
|
4.7 |
|
|
|
|
3. United States |
|
|
5.2 |
|
3. China |
|
|
|
4.0 |
|
|
|||
|
4. Japan |
|
|
|
|
2.6 |
|
4. United States |
|
|
3.8 |
|
|
||
|
5. China |
|
|
|
|
1.2 |
|
5. Korea, Republic of |
|
|
1.6 |
|
|
||
|
Unspecified destinations |
|
7.5 |
|
Unspecified origins |
|
|
0.5 |
|
|
|||||
|
|
|
|
|
|
|
|
|
|
|
|
|
|
|
|
|
COMMERCIAL SERVICES TRADE |
|
Value |
|
Annual percentage change |
|
|
||||||||
|
|
|
|
|
|
2004 |
|
1995-2004 |
|
2003 |
2004 |
|
|||
|
Commercial services exports (million US$) |
36 304 |
|
10 |
19 |
15 |
|||||||||
|
Commercial services imports (million US$) |
33 401 |
|
10 |
16 |
18 |
|
|
|||||||
|
|
|
|
|
|
|
|
|
|
|
|
|
|
|
|
|
|
|
|
|
2004 |
|
|
|
|
|
2004 |
|
|||
|
Share in world total exports |
1.67 |
|
Share in world total imports |
1.57 |
||||||||||
|
|
|
|
|
|
|
|
|
|
|
|
|
|
|
|
|
Breakdown in economy's total exports |
|
|
Breakdown in economy's total imports |
|
|
|
||||||||
|
By principal services item |
|
|
By principal services item |
|
|
|
|
|||||||
|
Transportation |
|
58.7 |
|
Transportation |
|
48.4 |
|
|
||||||
|
Travel |
|
15.6 |
|
Travel |
|
21.8 |
|
|
||||||
|
Other commercial services |
|
25.7 |
|
Other commercial services |
|
29.8 |
|
|
||||||
|
|
|
|
|
|
|
|
|
|
|
|
|
|
|
|
|
|
|
|
|
|
|
|
|
|
|
|
|
|
|
|
|
INDUSTRIAL PROPERTY |
|
|
|
|
|
|
|
|
|
|
|
|
||
|
|
|
|
Total |
Residents |
Non-residents |
|
|
|
|
Total |
Residents |
Non-residents |
|
|
|
Patents granted, 2002 |
16 469 |
486 |
15 983 |
|
Marks registered, 2002 |
10 034 |
3 331 |
6 703 |
|
|
||||
|
|
|
|
|
|
|
|
|
|
|
|
|
|
|
|
|
a Refers to 2003 values and to the average annual percentage change for 1995-2003. |
|
|
|
|
|
|||||||||
Source: WTO
| GDP | Gross Domestic Product: Den samlede produktions størrelse |
| MFN tariffs | Most favoured Nation (mest begunstigede nation) tariffs (told) |
| WTO accession | WTO medlemsskab |
| Countervailing | Som modtræk |
| Duty | Told/afgift |
| Tax revenue | Skatteindtægt |
| Commercial services | Forretningsservice, f.eks. skibsfart, salg af know-how, konsulentydelser |
| Property | Ejendom |
| Resident | Person, der bor i landet |
| Patents granted | Patenter udstedt |
Grammar Exercise: Relative pronouns who, which, that.... Make sentences using the correct relative pronoun by putting information from column to the right into sentence in the left column. Put in commas when necessary.
| PETE DOHERTY_(who, which eller that? + sætn. til højre) ____________ has sunk to a new low of disgusting behaviour. | is a famous pop star |
| The BABYSHAMBLES ______________ saw its singer squirt a syringe-full of his own blood at two MTV News cameramen after injecting heroin in view of the production team. | is one of the leading British rock bands |
| The camera lens _______________was splattered with Pete’s claret — leaving a horrified crew scared of infection and needing to sterilise thousands of pounds worth of filming equipment. | had just been cleaned |
| Doherty’s own bandmate DREW McCONNELL _______________________ was so angry with the singer that he stormed off. | plays the bass |
| It is only a fortnight since The Sun ______________ printed pictures of Pete sticking a syringe into a young girl fan’s arm. | is the paper with the largest circulation in Britain |
| This stunt _______________ is equally pathetic and unforgivable | is probably not the latest |
| MTV News ________________ had
managed to secure a backstage interview with Babyshambles after a gig in
Berlin. |
is always on the spot at the right time |
| Pete _______________ had refused to join his bandmates. | remains close to KATE MOSS |
| But midway through the interview Pete _____________ appeared in the room and sat down | was not the least sleepy |
| No one spotted the syringe ___________, although you can make it out in my exclusive sequence of pictures | he was holding |
| He then took aim and unloaded a barrel-full of his own blood _____________ on the camera lens from a few yards away | is not the healthiest stuff around |
| But his two bandmates, bassist Drew and dummer ADAM FICEK __________ were not pleased. Drew apologised to MTV _______________ saying: “I think the interview is over my friend. I’m really sorry about that mate, that’s ****ed up.” | thinks of the reputation of the band was really pissed off |
| Then Drew _______________ fled and was seen kicking a door in a rage down the corridor. Pete also left but returned to perform a song once MTV had managed to clean the lens ______________________. | is the quiet one in the band
|
Website on Giddens' Run Away world (Reith Lectures)
Arbejdsvilkår i økonomiske zoner
Om multinationale selskaber
UNDP Human Development